Understand Who Is Flaring, Where, and How Much
A consolidated view of U.S. gas flaring so your team can compare operators, spot problem regions, and plan infrastructure with fewer blind spots.
Maintained daily to reflect current flaring activity, not years-old public summaries.
Ready to see flaring intelligence in your region?
Delivered inside Rextag's Energy DataLink platform.
Find regions where persistent flaring signals under-gathered gas and missing capacity.
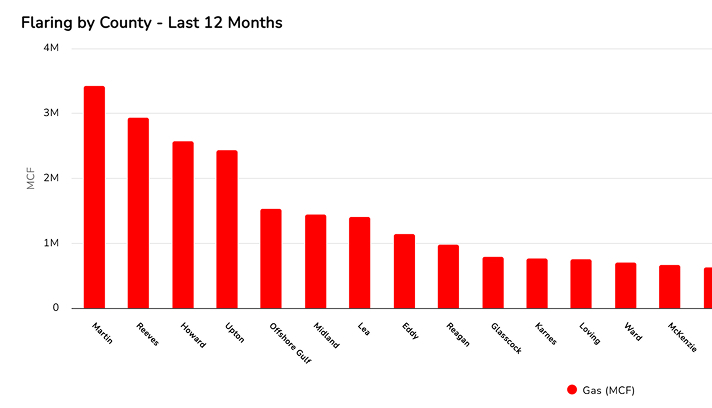
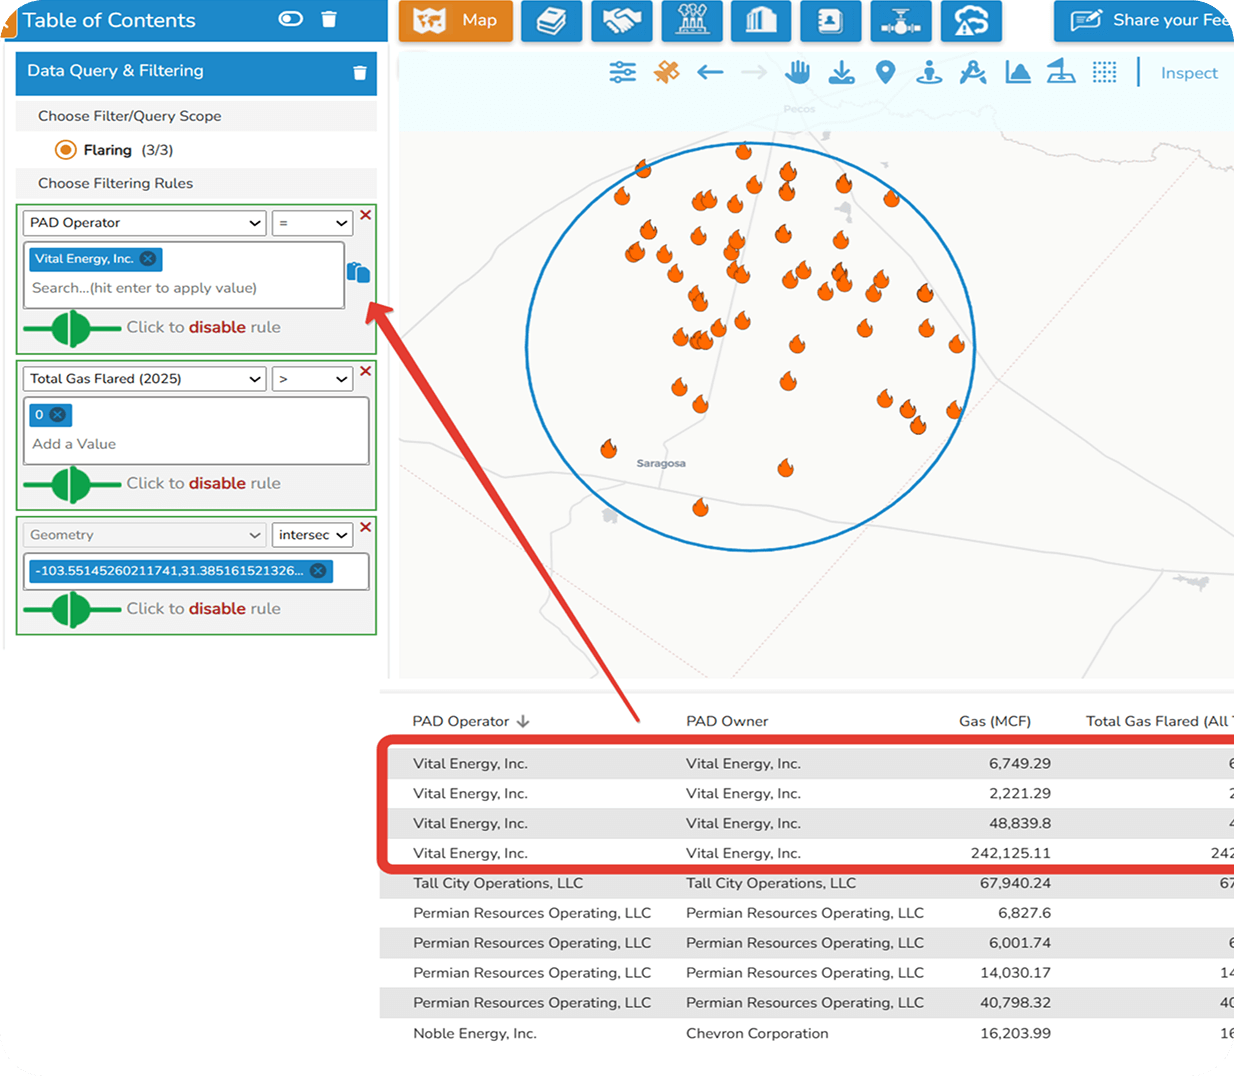
See flare volumes by operator and region, and benchmark behavior over time.
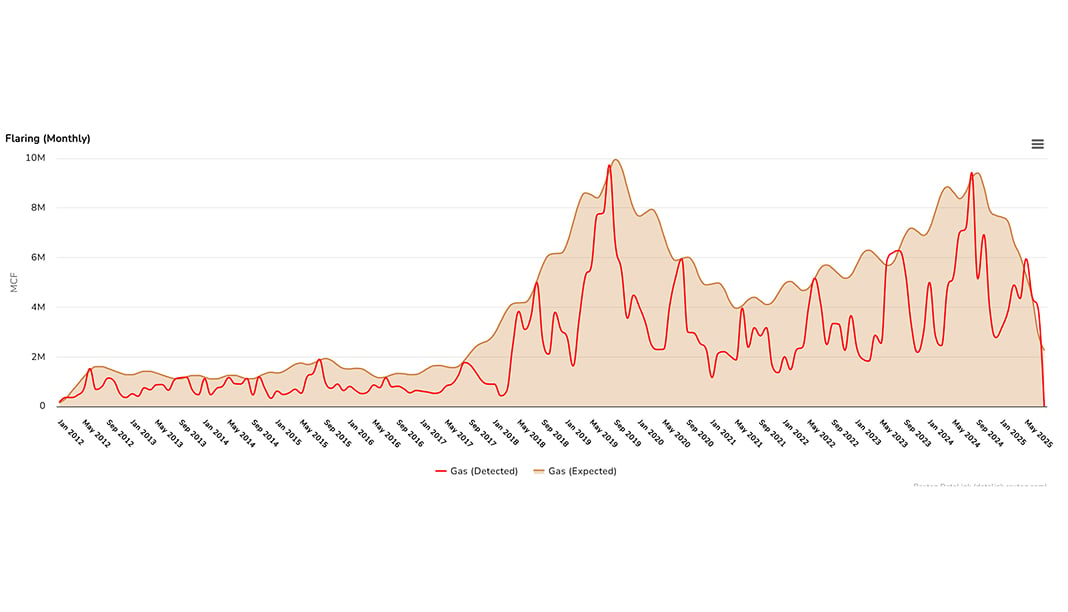
Bring flare intensity and trends into asset reviews, valuation, and work.
Built for Teams Focused on Gas Flaring
Use this dataset if your work depends on understanding flaring activity with a single accurate and consistent data source
-
Upstream operations and ESG teams
-
Midstream planning and business development
-
Energy investors and lenders
-
Environmental and risk specialists
Why Energy Teams Rely on Rextag
18+ years
mapping U.S. energy infrastructure for the entire energy supply chain
Millions of wells,
pipelines, terminals, refineries, power lines, and other facilities maintained in one system
Used by
operators, midstream teams, financial institutions, utilities, data centers, and other companies in the energy space
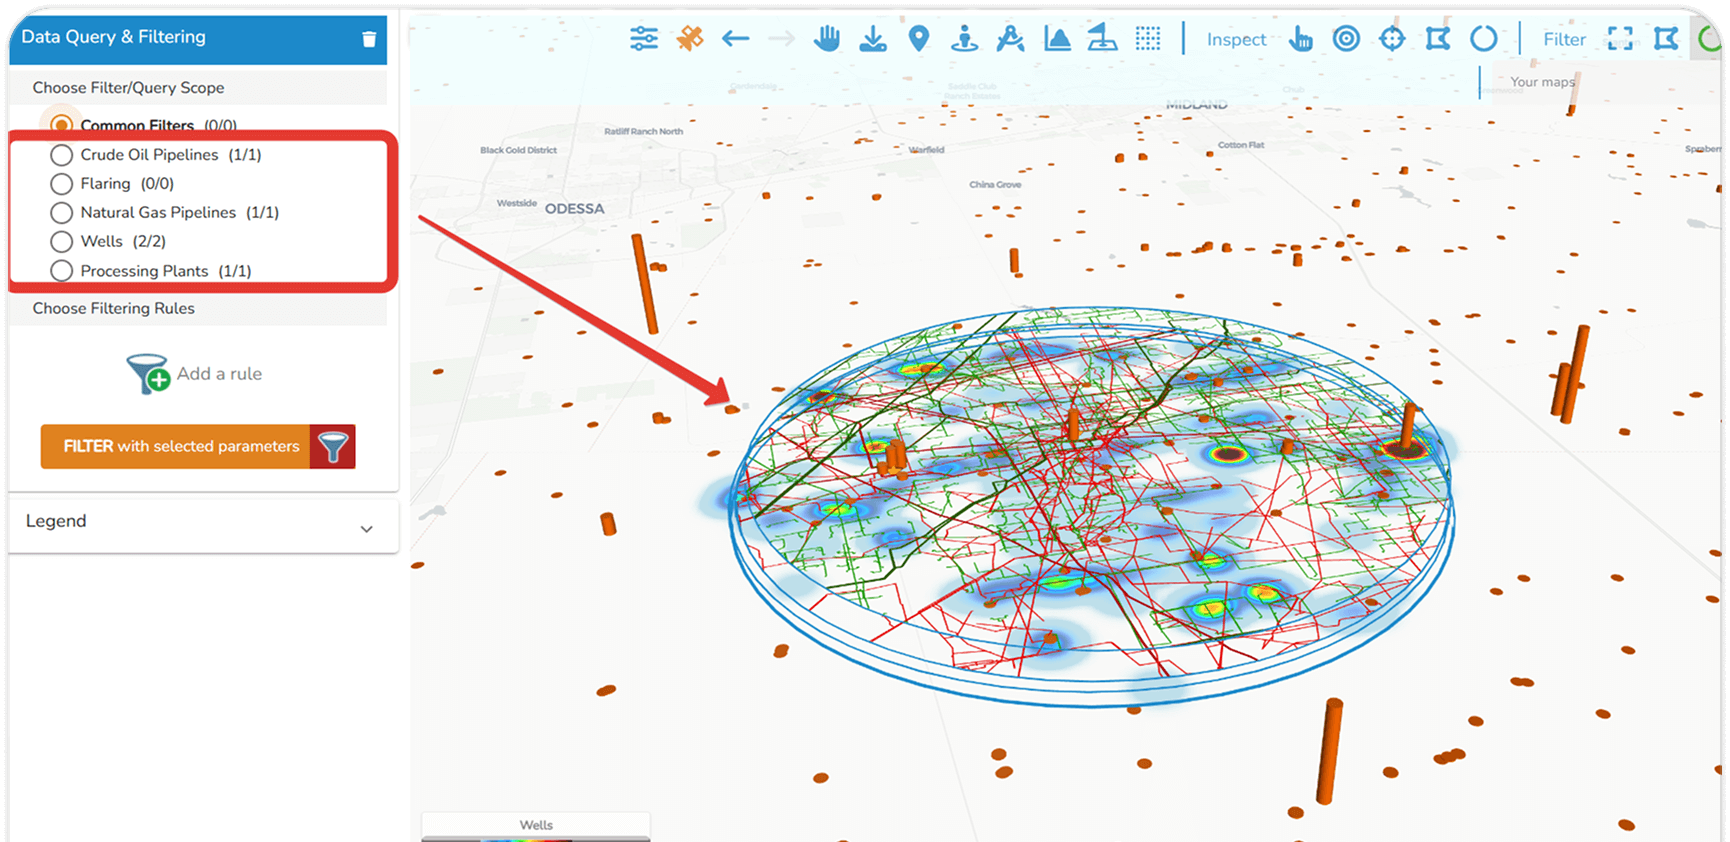
View flaring alongside wells, pipelines, processing plants,
and other infrastructure layers in Energy DataLink
What Makes This Dataset Different
- Links flare events to specific operators and facilities.
- Updated daily, without the multi-year reporting lag common in public flaring data.
- Maintains a single, consistent historical flaring record over time, not stitched together from disconnected sources.
What You Can Do With This Flaring View
1) Compare behavior, not claims
- See flare volumes by operator, basin, state, county, or facility.
- Benchmark operators over time.
- Track how flaring activity is responding to infrastructure additions/outages and other interventions in real time.
- View historical impacts.
2) Spot infrastructure gaps
- Identify regions where persistent flaring signals under-gathered gas.
- Support business cases for gathering or processing expansions.
- Monitor flaring before and after tie-ins.
3) Strengthen valuation and risk work
- Add flare intensity to asset reviews.
- Flag operators with persistent high flaring.
- Use consistent historical data in ESG models.
See How Flaring Intelligence Looks in Practice
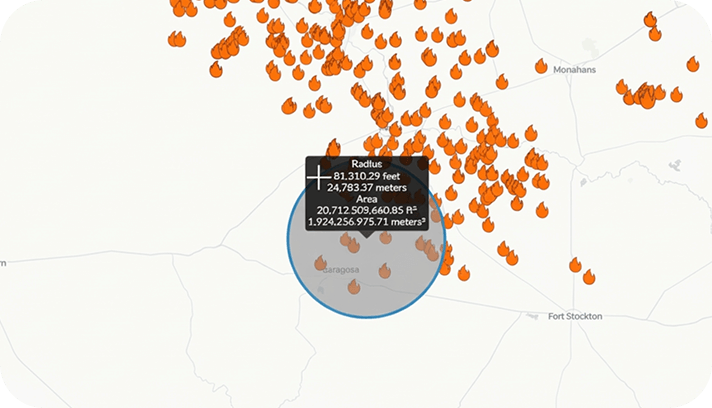
U.S. flaring map with basin and county filters
Operator-Level Flaring View
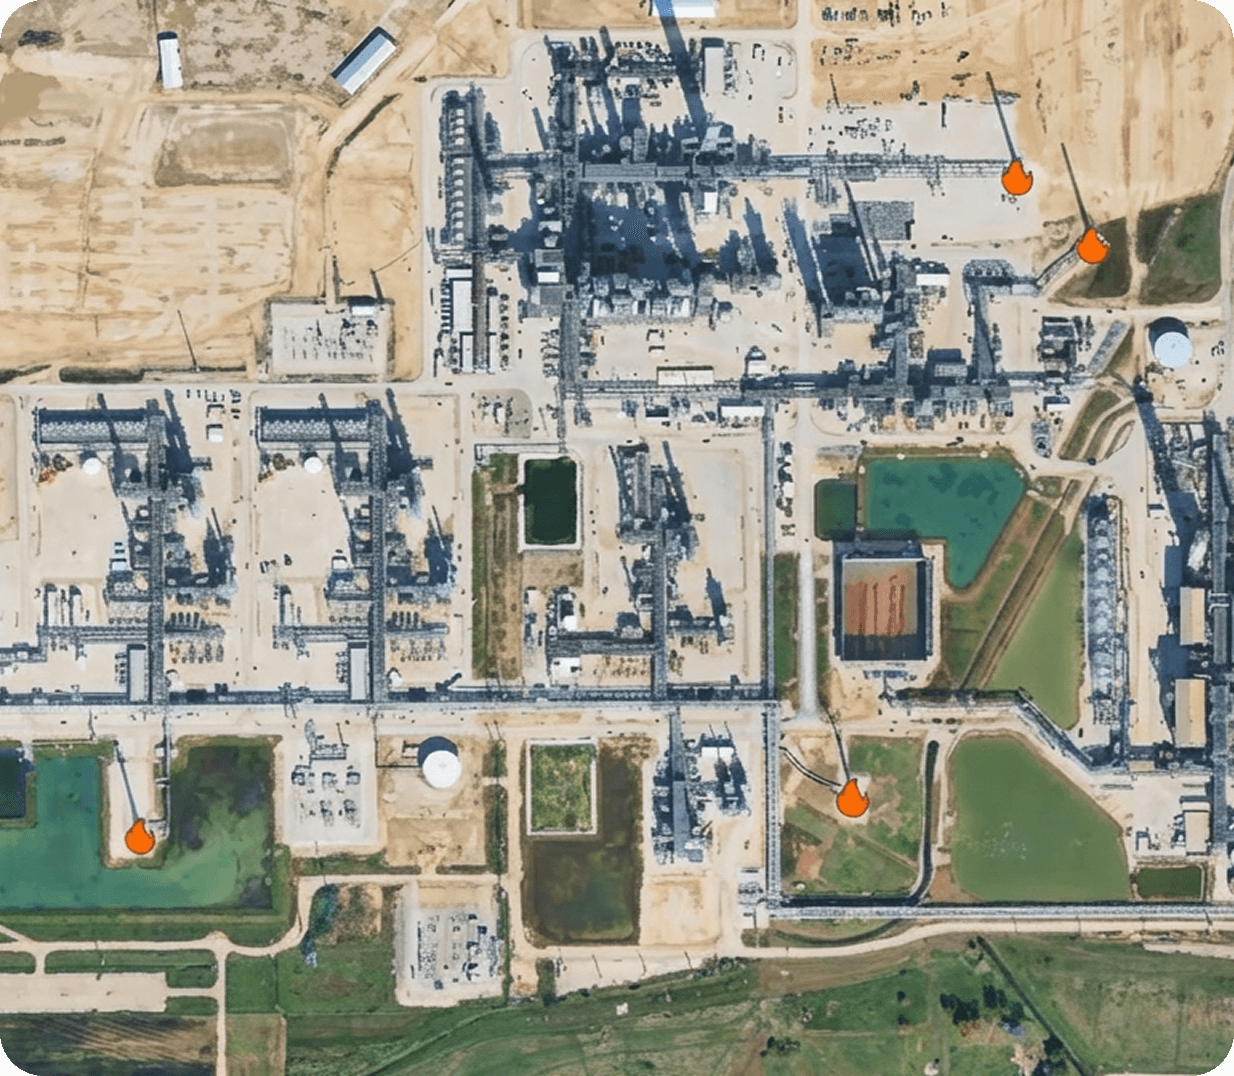
Review Facility-Level Flaring
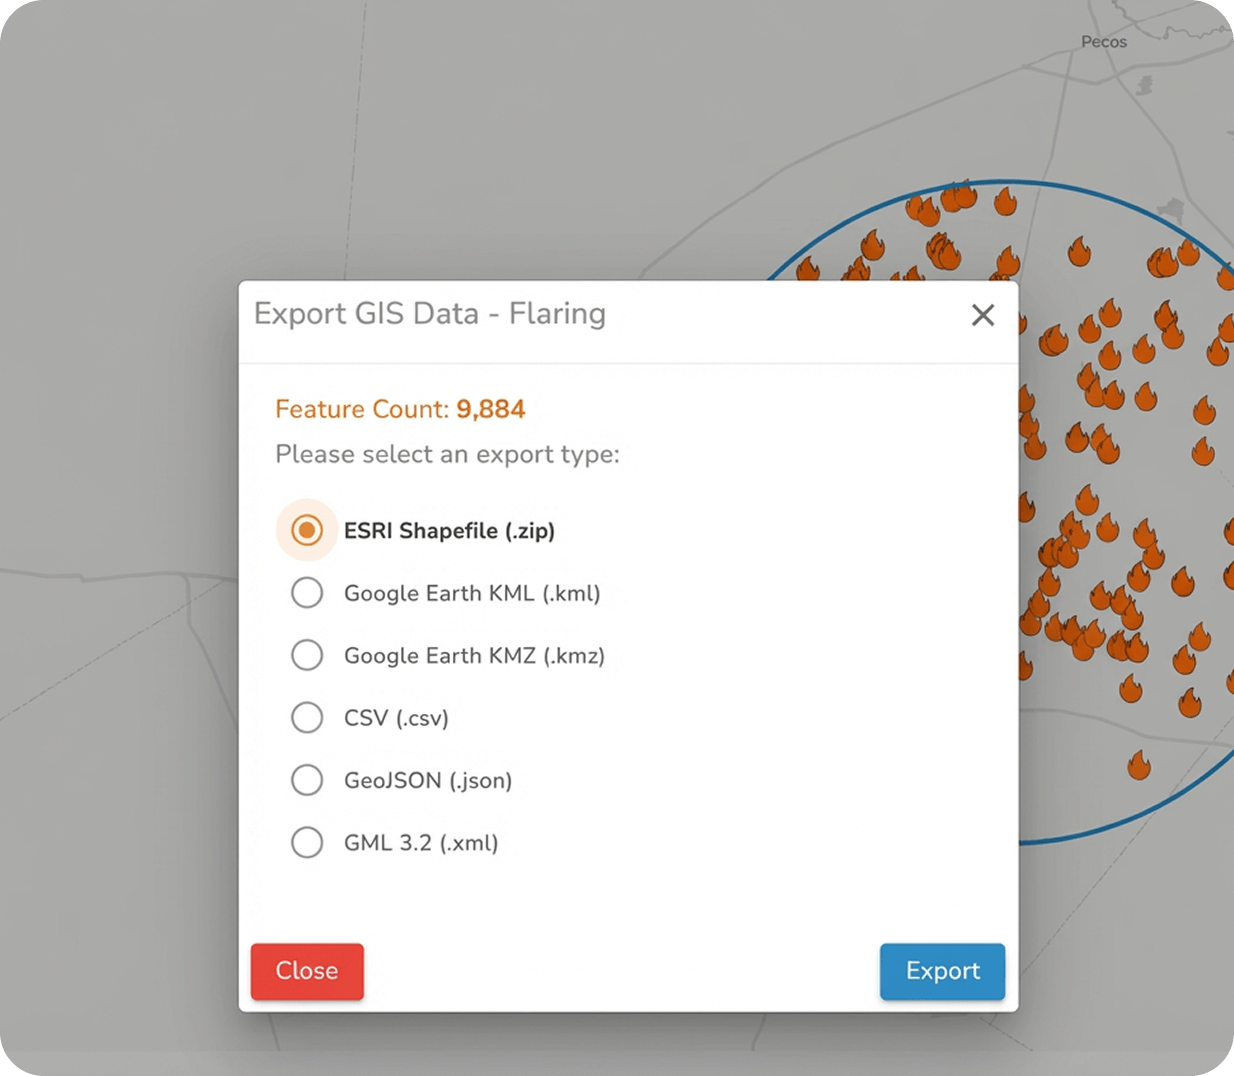
Export Options Panel
How Different Teams Use Flaring Intelligence
Upstream (E&P)
- Compare your flaring against peers.
- Identify under-gathered acreage.
- Compare flaring volumes against production metrics available in Rextag’s upstream datasets.
Midstream
- Locate areas where flaring indicates missing capacity.
- Build cases for gathering or processing expansions.
- Evaluate flaring activity in relation to nearby gathering, processing, and takeaway infrastructure.
Environmental / Risk Specialists
- Track regional hot spots.
- Correlate spikes with operational issues.
- Use consistent data for assessments.
Why Seeing Flaring Clearly Changes Decisions
- Flaring highlights where gas is stranded and where infrastructure lags production.
- Fragmented or delayed data forces teams to rely on assumptions.
- A consistent, current view of flaring supports stronger planning, valuation, and performance discussions.
Get a Complete View of Gas Flaring Across the U.S.
Put flaring data on the same footing as the rest of your infrastructure analysis.